Strategy Tester Report
AlpariUK-Demo (Build 225)
| Symbol | USDCAD (US Dollar vs Canadian Dollar) | ||||
| Period | 1 Hour (H1) 2009.12.01 00:00 - 2009.12.31 18:00 (2009.12.01 - 2010.01.01) | ||||
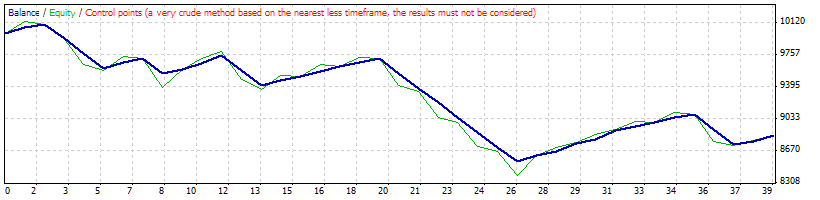
| Model | Control points (a very crude method, the results must not be considered) | ||||
| Parameters | TakeProfit=100; TakeProfit2=40; Stoploss=100; Lots=1; TrailingStop=30; per=18; per2=8; chas=2; totalt=1000; mm=0; risk=10; | ||||
| Bars in test | 1515 | Ticks modelled | 13777 | Modelling quality | n/a |
| Mismatched charts errors | 2 | ||||
| Initial deposit | 10000.00 | ||||
| Total net profit | -1152.95 | Gross profit | 1373.37 | Gross loss | -2526.32 |
| Profit factor | 0.54 | Expected payoff | -29.56 | ||
| Absolute drawdown | 1618.85 | Maximal drawdown | 1756.63 (17.33%) | Relative drawdown | 17.33% (1756.63) |
| Total trades | 39 | Short positions (won %) | 18 (61.11%) | Long positions (won %) | 21 (61.90%) |
| Profit trades (% of total) | 24 (61.54%) | Loss trades (% of total) | 15 (38.46%) | ||
| Largest | profit trade | 94.57 | loss trade | -170.81 | |
| Average | profit trade | 57.22 | loss trade | -168.42 | |
| Maximum | consecutive wins (profit in money) | 9 (536.44) | consecutive losses (loss in money) | 7 (-1170.45) | |
| Maximal | consecutive profit (count of wins) | 536.44 (9) | consecutive loss (count of losses) | -1170.45 (7) | |
| Average | consecutive wins | 4 | consecutive losses | 3 | |
| # | Time | Type | Order | Size | Price | S / L | T / P | Profit | Balance |
| 1 | 2009.12.01 21:00 | buy | 1 | 1.00 | 1.04445 | 1.04267 | 1.04545 | ||
| 2 | 2009.12.01 21:02 | buy | 2 | 1.00 | 1.04437 | 1.04259 | 1.04537 | ||
| 3 | 2009.12.01 21:20 | close | 1 | 1.00 | 1.04513 | 1.04267 | 1.04545 | 65.06 | 10065.06 |
| 4 | 2009.12.01 21:22 | close | 2 | 1.00 | 1.04482 | 1.04259 | 1.04537 | 43.07 | 10108.13 |
| 5 | 2009.12.02 21:00 | buy | 3 | 1.00 | 1.05191 | 1.05013 | 1.05291 | ||
| 6 | 2009.12.02 21:50 | s/l | 3 | 1.00 | 1.05013 | 1.05013 | 1.05291 | -169.52 | 9938.61 |
| 7 | 2009.12.03 21:00 | sell | 4 | 1.00 | 1.05336 | 1.05514 | 1.05236 | ||
| 8 | 2009.12.03 21:02 | sell | 5 | 1.00 | 1.05282 | 1.05460 | 1.05182 | ||
| 9 | 2009.12.03 21:20 | s/l | 5 | 1.00 | 1.05460 | 1.05460 | 1.05182 | -168.78 | 9769.83 |
| 10 | 2009.12.03 21:45 | s/l | 4 | 1.00 | 1.05514 | 1.05514 | 1.05236 | -168.66 | 9601.17 |
| 11 | 2009.12.04 21:00 | sell | 6 | 1.00 | 1.05928 | 1.06106 | 1.05828 | ||
| 12 | 2009.12.04 21:02 | sell | 7 | 1.00 | 1.05922 | 1.06100 | 1.05822 | ||
| 13 | 2009.12.04 21:15 | close | 6 | 1.00 | 1.05853 | 1.06106 | 1.05828 | 70.85 | 9672.02 |
| 14 | 2009.12.04 21:17 | close | 7 | 1.00 | 1.05878 | 1.06100 | 1.05822 | 41.56 | 9713.58 |
| 15 | 2009.12.07 21:00 | sell | 8 | 1.00 | 1.05268 | 1.05446 | 1.05168 | ||
| 16 | 2009.12.07 21:02 | sell | 9 | 1.00 | 1.05239 | 1.05417 | 1.05139 | ||
| 17 | 2009.12.07 21:20 | s/l | 9 | 1.00 | 1.05417 | 1.05417 | 1.05139 | -168.83 | 9544.75 |
| 18 | 2009.12.07 22:20 | close | 8 | 1.00 | 1.05221 | 1.05446 | 1.05168 | 44.67 | 9589.42 |
| 19 | 2009.12.08 21:00 | sell | 10 | 1.00 | 1.06683 | 1.06861 | 1.06583 | ||
| 20 | 2009.12.08 21:02 | sell | 11 | 1.00 | 1.06666 | 1.06844 | 1.06566 | ||
| 21 | 2009.12.08 21:15 | close | 10 | 1.00 | 1.06607 | 1.06861 | 1.06583 | 71.29 | 9660.71 |
| 22 | 2009.12.08 21:20 | t/p | 11 | 1.00 | 1.06566 | 1.06844 | 1.06566 | 93.88 | 9754.59 |
| 23 | 2009.12.09 21:00 | buy | 12 | 1.00 | 1.05456 | 1.05278 | 1.05556 | ||
| 24 | 2009.12.09 21:03 | buy | 13 | 1.00 | 1.05369 | 1.05191 | 1.05469 | ||
| 25 | 2009.12.09 21:10 | s/l | 12 | 1.00 | 1.05278 | 1.05278 | 1.05556 | -169.16 | 9585.43 |
| 26 | 2009.12.09 21:16 | s/l | 13 | 1.00 | 1.05191 | 1.05191 | 1.05469 | -169.30 | 9416.13 |
| 27 | 2009.12.10 21:00 | buy | 14 | 1.00 | 1.05091 | 1.04913 | 1.05191 | ||
| 28 | 2009.12.10 21:02 | buy | 15 | 1.00 | 1.05093 | 1.04915 | 1.05193 | ||
| 29 | 2009.12.10 22:45 | close | 14 | 1.00 | 1.05151 | 1.04913 | 1.05191 | 57.06 | 9473.19 |
| 30 | 2009.12.10 22:47 | close | 15 | 1.00 | 1.05135 | 1.04915 | 1.05193 | 39.95 | 9513.14 |
| 31 | 2009.12.11 21:00 | sell | 16 | 1.00 | 1.06065 | 1.06243 | 1.05965 | ||
| 32 | 2009.12.11 21:02 | sell | 17 | 1.00 | 1.06086 | 1.06264 | 1.05986 | ||
| 33 | 2009.12.11 21:50 | close | 16 | 1.00 | 1.06005 | 1.06243 | 1.05965 | 56.60 | 9569.74 |
| 34 | 2009.12.11 21:52 | close | 17 | 1.00 | 1.06027 | 1.06264 | 1.05986 | 55.65 | 9625.39 |
| 35 | 2009.12.14 21:00 | sell | 18 | 1.00 | 1.05942 | 1.06120 | 1.05842 | ||
| 36 | 2009.12.14 21:02 | sell | 19 | 1.00 | 1.05961 | 1.06139 | 1.05861 | ||
| 37 | 2009.12.14 22:20 | close | 18 | 1.00 | 1.05895 | 1.06120 | 1.05842 | 44.38 | 9669.77 |
| 38 | 2009.12.14 22:25 | close | 19 | 1.00 | 1.05910 | 1.06139 | 1.05861 | 48.15 | 9717.92 |
| 39 | 2009.12.15 21:00 | sell | 20 | 1.00 | 1.06130 | 1.06308 | 1.06030 | ||
| 40 | 2009.12.15 21:02 | sell | 21 | 1.00 | 1.06128 | 1.06306 | 1.06028 | ||
| 41 | 2009.12.16 06:20 | s/l | 20 | 1.00 | 1.06308 | 1.06308 | 1.06030 | -167.88 | 9550.04 |
| 42 | 2009.12.16 06:20 | s/l | 21 | 1.00 | 1.06306 | 1.06306 | 1.06028 | -167.88 | 9382.16 |
| 43 | 2009.12.16 21:00 | buy | 22 | 1.00 | 1.06369 | 1.06191 | 1.06469 | ||
| 44 | 2009.12.16 21:02 | buy | 23 | 1.00 | 1.06424 | 1.06246 | 1.06524 | ||
| 45 | 2009.12.16 21:15 | s/l | 23 | 1.00 | 1.06246 | 1.06246 | 1.06524 | -167.58 | 9214.58 |
| 46 | 2009.12.16 21:20 | s/l | 22 | 1.00 | 1.06191 | 1.06191 | 1.06469 | -167.72 | 9046.86 |
| 47 | 2009.12.17 21:00 | sell | 24 | 1.00 | 1.06994 | 1.07172 | 1.06894 | ||
| 48 | 2009.12.17 21:02 | sell | 25 | 1.00 | 1.06966 | 1.07144 | 1.06866 | ||
| 49 | 2009.12.17 22:15 | s/l | 24 | 1.00 | 1.07172 | 1.07172 | 1.06894 | -166.07 | 8880.79 |
| 50 | 2009.12.17 22:15 | s/l | 25 | 1.00 | 1.07144 | 1.07144 | 1.06866 | -166.06 | 8714.73 |
| 51 | 2009.12.18 21:00 | buy | 26 | 1.00 | 1.06657 | 1.06479 | 1.06757 | ||
| 52 | 2009.12.18 21:03 | buy | 27 | 1.00 | 1.06600 | 1.06422 | 1.06700 | ||
| 53 | 2009.12.18 21:16 | s/l | 26 | 1.00 | 1.06479 | 1.06479 | 1.06757 | -167.26 | 8547.47 |
| 54 | 2009.12.18 22:15 | close | 27 | 1.00 | 1.06676 | 1.06422 | 1.06700 | 71.24 | 8618.71 |
| 55 | 2009.12.21 21:00 | buy | 28 | 1.00 | 1.06214 | 1.06036 | 1.06314 | ||
| 56 | 2009.12.21 21:02 | buy | 29 | 1.00 | 1.06210 | 1.06032 | 1.06310 | ||
| 57 | 2009.12.21 21:15 | close | 28 | 1.00 | 1.06261 | 1.06036 | 1.06314 | 44.23 | 8662.94 |
| 58 | 2009.12.21 21:20 | t/p | 29 | 1.00 | 1.06310 | 1.06032 | 1.06310 | 94.06 | 8757.00 |
| 59 | 2009.12.22 21:00 | buy | 30 | 1.00 | 1.05632 | 1.05454 | 1.05732 | ||
| 60 | 2009.12.22 21:02 | buy | 31 | 1.00 | 1.05628 | 1.05450 | 1.05728 | ||
| 61 | 2009.12.22 21:35 | close | 30 | 1.00 | 1.05681 | 1.05454 | 1.05732 | 46.37 | 8803.37 |
| 62 | 2009.12.22 21:40 | t/p | 31 | 1.00 | 1.05728 | 1.05450 | 1.05728 | 94.57 | 8897.94 |
| 63 | 2009.12.23 21:00 | buy | 32 | 1.00 | 1.04862 | 1.04684 | 1.04962 | ||
| 64 | 2009.12.23 21:02 | buy | 33 | 1.00 | 1.04852 | 1.04674 | 1.04952 | ||
| 65 | 2009.12.23 23:45 | close | 32 | 1.00 | 1.04912 | 1.04684 | 1.04962 | 47.66 | 8945.60 |
| 66 | 2009.12.23 23:47 | close | 33 | 1.00 | 1.04901 | 1.04674 | 1.04952 | 46.71 | 8992.31 |
| 67 | 2009.12.28 21:00 | buy | 34 | 1.00 | 1.04350 | 1.04172 | 1.04450 | ||
| 68 | 2009.12.28 21:02 | buy | 35 | 1.00 | 1.04345 | 1.04167 | 1.04445 | ||
| 69 | 2009.12.29 03:20 | close | 34 | 1.00 | 1.04406 | 1.04172 | 1.04450 | 52.98 | 9045.29 |
| 70 | 2009.12.29 03:22 | close | 35 | 1.00 | 1.04386 | 1.04167 | 1.04445 | 38.62 | 9083.91 |
| 71 | 2009.12.29 21:00 | buy | 36 | 1.00 | 1.04395 | 1.04217 | 1.04495 | ||
| 72 | 2009.12.29 21:02 | buy | 37 | 1.00 | 1.04393 | 1.04215 | 1.04493 | ||
| 73 | 2009.12.29 21:20 | s/l | 36 | 1.00 | 1.04217 | 1.04217 | 1.04495 | -170.81 | 8913.10 |
| 74 | 2009.12.29 21:20 | s/l | 37 | 1.00 | 1.04215 | 1.04215 | 1.04493 | -170.81 | 8742.29 |
| 75 | 2009.12.30 21:00 | sell | 38 | 1.00 | 1.05540 | 1.05718 | 1.05440 | ||
| 76 | 2009.12.30 21:02 | sell | 39 | 1.00 | 1.05569 | 1.05747 | 1.05469 | ||
| 77 | 2009.12.30 22:16 | close | 39 | 1.00 | 1.05527 | 1.05747 | 1.05469 | 39.80 | 8782.09 |
| 78 | 2009.12.31 00:20 | close | 38 | 1.00 | 1.05470 | 1.05718 | 1.05440 | 64.96 | 8847.05 |